Preview gallery
The job to start with
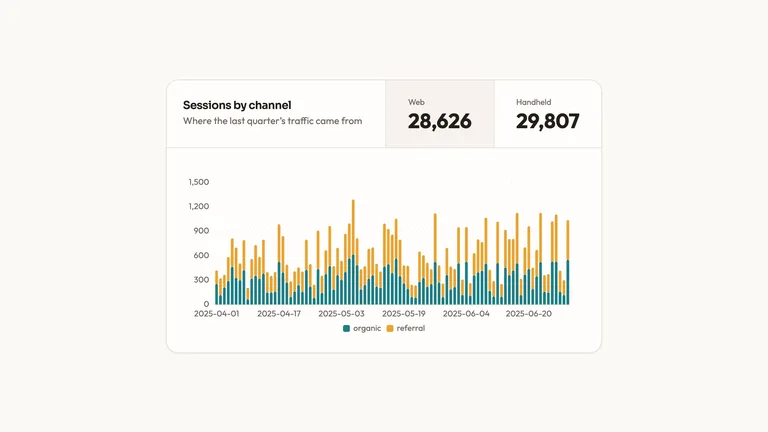
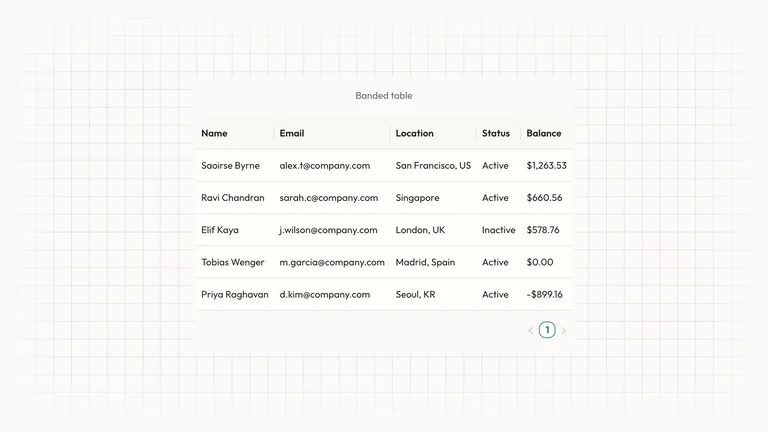
Use Paired Column Chart to compare two values within each category. Start by deciding what your audience needs to understand; use the preview to judge whether this format serves that goal.
Picked most often by
Plan your first result
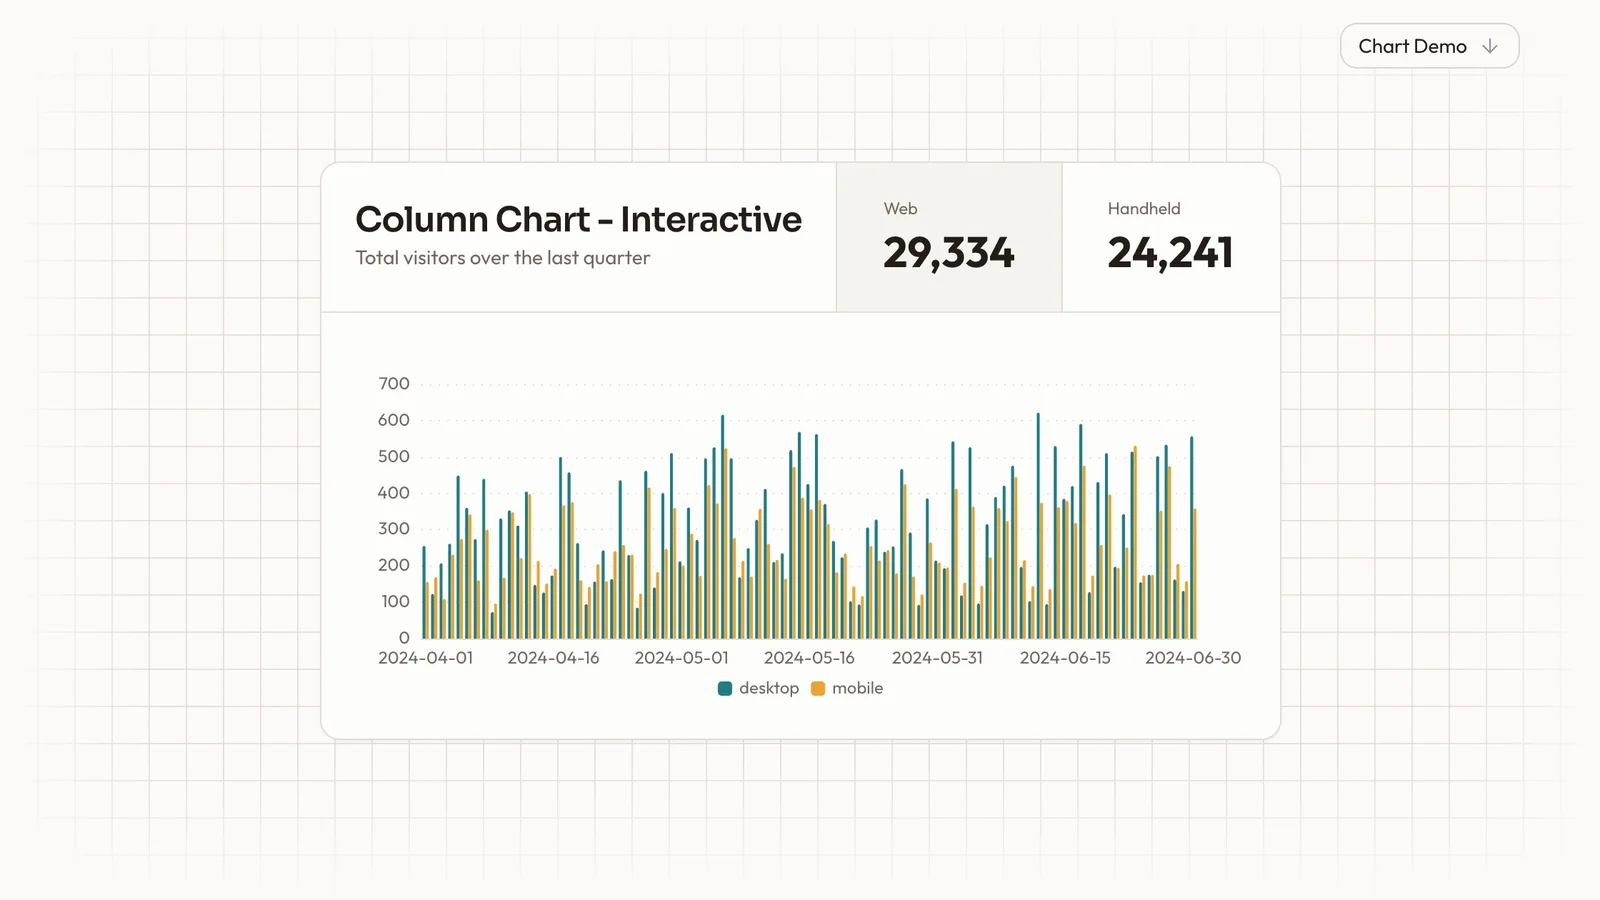
Use the brief below as a starting point. Replace the placeholders, review a small draft, then expand it.
When to choose it
You need a starting implementation to adapt to your own content and service. Use the preview to judge the page structure, then define the visitor action.
Prepare the material
Prepare your real copy, approved images, destination links and the services each interactive control should call. Label demonstration data explicitly.
A first brief to adapt
Use Paired Column Chart to compare two values within each category. My audience is [audience], and the material I can provide is [sources]. Adapt the main user journey first. Test it with your actual content before extending the design to every section. Label units, period and source. Test missing data separately from zero and compare the rendered values to your input before connecting a live data feed. Flag missing facts before producing the final output.
The review that matters here
Label units, period and source. Test missing data separately from zero and compare the rendered values to your input before connecting a live data feed.
Know the boundary
A visual prototype does not by itself provide a production database, authentication, payments or live inventory. Check the package and connect the services your project needs.
What you need before you start
- Dependencies
- ECharts — required
- Package compatibility record
- v1.0.3 — Claude Code / Claude Desktop / Cowork / Codex / ChatGPT
From package to deliverable
- The download is a workflow package for your agent. Use the existing preview to choose a direction, then adapt the resulting source to your own project.
- For a component, review it inside the host page. For a complete site, check the whole visitor journey, including empty and error states.
A useful first milestone
- A workflow to compare two values within each category.
Before handing it over
- Label units, period and source. Test missing data separately from zero and compare the rendered values to your input before connecting a live data feed.
- A visual prototype does not by itself provide a production database, authentication, payments or live inventory. Check the package and connect the services your project needs.
Client & Executive ReportingResearch & Technical CommunicationWeb Design & Digital ExperiencesCreate InfographicCreate UI VisualsBuild Website PageEditable OutputVisually PolishedBeginner-friendlyWarm NeutralTeal AccentGenerative Backdrop
User reviews
Loading reviews…
FAQ
Label units, period and source. Test missing data separately from zero and compare the rendered values to your input before connecting a live data feed.
Adapt the main user journey first. Test it with your actual content before extending the design to every section.
A visual prototype does not by itself provide a production database, authentication, payments or live inventory. Check the package and connect the services your project needs.